1. Introduction
Since being introduced in the early 1960s, the 18% nickel (18Ni) family of maraging steels remains important to the aerospace, defense, nuclear, as well as the tool and die industries due to their unique combination of different properties, including high strength, high hardness, excellent toughness, ease of welding, good machinability, and dimensional stability [
1,
2]. Furthermore, the low carbon content of 18Ni maraging steels develops (on cooling from elevated temperatures) a soft martensitic matrix that is mostly free from interstitial alloying elements and less prone to cracking during solidification from the liquid state; thus, this makes these steels appropriately suited for processing additively [
3]. Considering the relatively high cost of nickel and microalloy additions to these steels, the circular economy possible with additive manufacturing (AM) provides material savings, inasmuch as the recycling of the 18Ni maraging steel powder promises [
4]. Additive processing of 18Ni maraging steels is also of avid interest for architecting conformal channels [
5,
6] for transpiration cooling, so as to mitigate partial reversion of martensite into austenite [
7], as well as the accompanying strength losses and geometric instabilities [
5,
8,
9,
10,
11], especially during cyclic/extended service at elevated temperatures. To date, this improved cooling efficiency—which was made possible in maraging steel parts designed with novel conformal channels and fabricated using metal AM technologies (particularly with LPBF processing)—has reduced process cycle times in injection molding [
12] of plastics and, more recently, in high-pressure die casting of metals [
13], where the pressures and temperatures are significantly greater.
However, the surface accuracy and areal roughness directly after AM using LPBF processes remain far below [
14,
15] industrial requirements of maraging steel parts used in applications needing tight geometric tolerances, machined finishes, and/or fatigue strength. Thus, post-processing with a machining step after AM is necessary for excess material removal for suitable conformance to the part geometry and to meet the surface roughness requirements, typically between 0.2–0.5 µm [
16]. Undertaken separately, serial additive-subtractive production of high-complexity parts faces challenges for suitable referencing, indexing, and programming that can obliterate the cost benefits in the break-even analysis for AM. Unsurprisingly, recent developments have intensified in hybrid manufacturing that integrates LPBF AM and conventional subtractive processing within a single work envelope to enable synergies from both technologies [
17].
In such hybrid additive/subtractive manufacturing systems, the part is built layer-by-layer using LPBF, followed by machining to remove excessive material and smooth “stair-stepping effects” on layer-manufactured surfaces to improve the surface quality. Machining is either performed after each layer or a number of layers with the objective of enabling a high-quality part with the required net-shape/geometry, dimensional tolerances, and surface finish. The synergies of hybridization have distinctive/disruptive advantages for building intricate/complex geometries with internal architected features (such as conformal channels for cooling and/or cellular structures for permeability) and machining (within the geometric limitations of the toolpath) high-quality surface finishes with tight dimensional tolerances in a single setup (in-envelope process) [
18].
Development of this hybrid manufacturing process, however, requires a detailed understanding of the effect of build process parameters and interactions, as well as the synergies of the additive and subtractive sequences that affect the microstructure, defects, residual stresses, distortion, dimensional integrity of machined surfaces, and mechanical properties of the final part. To date, many LPBF research studies have been performed using stand-alone AM systems to examine either process parameter optimization or mechanical properties of maraging steels. For 18Ni-300 maraging steel, Casalino et al. [
19] investigated the influence of process parameters on density, while Bai et al. [
20] conducted experiments on parametric optimization to avoid vaporization and spatter. In addition, Suryawanshi et al. [
21] investigated the anisotropic behavior of as-printed and solution-aged samples. Despite the relative newness of hybrid (LPBF) manufacturing, state-of-the-art research studies have also provided some early understandings of the separate influences of the additive-subtractive processes. For example, Tamura et al. [
22] reported on the anisotropic milling forces during hybrid (LPBF) manufacturing of maraging steels, while Sugino et al. [
23] studied the gas permeability of lattice structures in maraging steel permeable molds. On the additive end, Enemuoh et al. [
24] measured the density, hardness, and tensile properties of 18Ni-300 maraging steel samples built using hybrid (LPBF) manufacturing with one parameter set that was not disclosed, and is thus difficult to link to the process. The research work of Wüst et al. [
25] and Mutua et al. [
26] involved the design of experiment approach to optimize the parameters for surface finish and densification, respectively. However, the optimal combination of additive parameters identified by Wüst et al. [
25] for minimizing the as-printed surface roughness was at a significantly higher energy density (ED) (~112 J/mm
3) than the optimal condition reported for densification (71 J/mm
3) by Mutua et al. [
26]. More perplexing are the lower as-printed tensile properties, as reported by Mutua et al. [
26], after optimizing the hybrid (LPBF) manufacturing process for 18Ni-300 maraging steel, which gave an ultimate tensile strength (UTS) of 1125 MPa with a percent elongation (EL) of ~8.2% in the vertical direction, relative to that reported by Enemuoh et al. [
24] of 1205 MPa and 14%, respectively, for the same orientation, but using undisclosed process conditions.
Based on these previous preliminary findings, the characteristics and performance of 18Ni-300 maraging steel are sensitive to the hybrid (LPBF) manufacturing process that require a systemic study for parametric optimization, as well as interrelating to the porosity, macro/microstructure, mechanical properties, and fracture. Therefore, the research priorities in this present study were defined to systematically examine the effect of parametric changes on hybrid (LPBF) manufacturing of 18Ni-300 maraging steel with a Matsuura LUMEX Avance-25 additive-subtractive system. Rectangular prismatic-shaped coupons were printed—to more closely represent mold/die structures (as opposed to directly printed tensile samples)—and examined comprehensively in the as-printed (non-aged) condition for geometric conformity, surface finish, density, porosity, macro/microstructure, hardness, tensile properties, and fracture behavior, so as to develop the process–structure–property linkages.
2. Experimental Procedure
The 18Ni-300 maraging steel (or X3NiCoMoTi18-9-5) powder used in this work was supplied by Matsuura (St. Paul, MN, USA) with a chemical composition (wt.%), as shown in .
Table 1. Chemical composition (wt.%) of 18Ni-300 maraging steel powder.
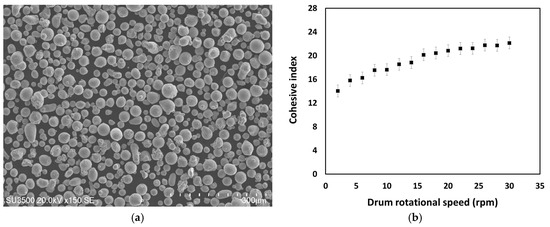
Measurement of the particle size distribution of the starting powder was performed using a Horiba laser scattering particle size analyzer LA-920 (Minami-ku, Kyoto, Japan) and showed a D10 (10th percentile) of 23 µm, a D50 (median) of 34 µm, and a D90 (90th percentile) of 52 µm. The surface morphology of the powder, analyzed using a Hitachi SU3500 (Fukuoka-shi, Fukuoka, Japan) scanning electron microscope (SEM), revealed predominantly spherical particles with smooth surfaces, regular morphologies, and a few satellites. A limited number of elongated and irregular particles was also present, as shown in a.
Figure 1. (a) SEM image showing the powder morphology, and (b) the cohesive index of 18Ni-300 maraging steel powder versus the drum rotation speed.
The static flow behavior of the powder was measured using Hall and Carney flowmeter funnels, according to ASTM B213 and ASTM B964 standards [
27,
28], respectively. The flowability per 50 g of powder through the Hall and Carney funnels was 23 s and 3 s, respectively. The apparent density (AD) of the powder was measured according to ASTM B212 and ASTM B417 standards [
29,
30], and was found to be 4.28 g/cm
3 and 4.31 g/cm
3 with the Hall and Carney funnels, respectively. The static angle of repose (AOR), calculated using an image analysis software (Image J) from the conical pile-up of powders, was statistically similar to 38° and, based on Carr’s classification of powder flowability, was sufficient for promoting good powder spreading during printing for minimizing defects [
31].
The cohesive index of the powder particles was measured using a Granudrum
® rotating drum system with angular velocities ranging from 2–30 rpm, and 40 images of the drum were captured at an interval of 1 frame/s for each revolution per minute. The average location of the air/powder interface and the fluctuations from the average interface at each angular velocity were computed by the built-in GranuDrum
® software from which the cohesive index was calculated. As depicted in b, the measured data show a relatively low cohesive index. This current value is indicative of good powder flowability based on previously reported findings [
32] (i.e., powders with a cohesive index below 24 exhibit free-flowing behavior and result in a uniform and homogenous layer during powder spreading in the LPBF process).
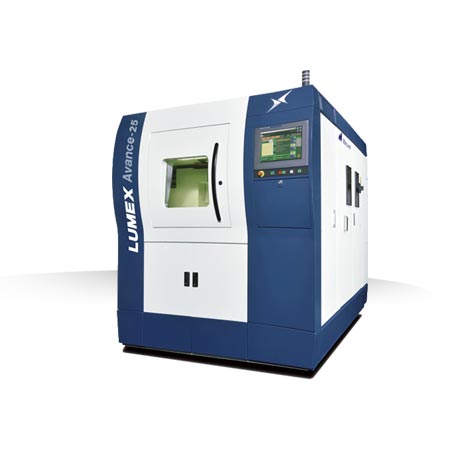
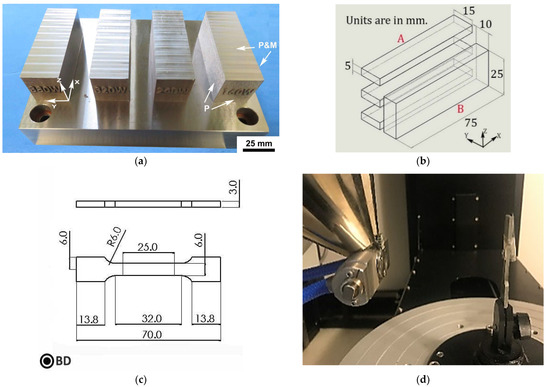
Hybrid manufacturing with the 18Ni-300 maraging steel powder was undertaken in a Matsuura LUMEX Avance-25 system via the LPBF technology integrated with high-speed milling to fabricate 4 rectangular prismatic-shaped coupons with dimensions of 75 mm (X) × 25 mm (Y) × 25 mm (Z) on a 4140 steel build plate with dimensions of 125 mm (X) × 175 mm (Y) × 30 mm (Z). The build plate was demagnetized using a surface demagnetizer (Electro-Matic model A13-1, R. B. Annis, ELMATCO, Chicago, IL, USA) to achieve a suitable magnetic field of <0.2 Gauss, and was then fixed onto the table of the Matsuura LUMEX Avance-25 system. During the hybrid (LPBF) manufacturing process, the build plate temperature was set to 50 °C, and the working chamber was filled with nitrogen gas (consisting of no more than 3% oxygen) to prevent oxidization of the molten pool during laser melting. A uni-directional laser scanning strategy with a 90° rotation after every layer was used for LPBF printing at 4 different powers (P)—160 W, 240 W, 320 W, and 380 W—which were used for both the rastering/infill and contouring passes (one of each per layer). The parameters used in the experimental design are listed in for the laser scan speed (v), spot diameter (d), hatch distance (h), and layer thickness (t). After LPBF printing of 10 successive layers, milling was performed at a feed rate of 2000 mm/min with a 0.1-mm radial depth of cut for the vertical side-walls and 4 mm for the horizontal top surface, based on the manufacturer’s recommended setting.
Table 2. Experimental parameters for hybrid (LPBF) manufacturing of the 18Ni-300 maraging steel.
It is noteworthy that the power levels of 160 W, 240 W, 320 W, and 380 W in this study correspond to infill ED values of 38.1 J/mm3, 57.1 J/mm3, 76.2 J/mm3, and 90.5 J/mm3, and contour ED values of 19.0 J/mm3, 28.6 J/mm3, 38.1 J/mm3, and 45.2 J/mm3, respectively, as shown in and calculated using Equation (1):
The geometry after printing of the 4 rectangular prismatic-shaped coupons (still attached to build plate), as shown in a, was inspected using an ATOS Core optical three-dimensional (3D) scanning system (GOM-Trilion Quality Systems, King of Prussia, PA, USA) and the measured dimensions were compared to the 3D CAD model to assess the conformity/accuracy. Then, electro-discharge machining (EDM) (FANUC Robocut C400iB, Oshino-mura, Yamanashi, Japan) with a 0.2-mm diameter brass wire was used to separate the coupons from the build plate. The surface quality of coupons on both as-printed and machined faces was evaluated using a portable Mitutoyo Surftest SJ-210 4MN profilometer and a Keyence VK-X250 3D laser scanning confocal microscope to measure the linear roughness parameters (arithmetic mean height (Ra), root mean square height (Rq), and maximum height (Rz)), as well as surface roughness parameters (Sa, Sq, and Sz, that are areal counterparts of Ra, Rq, and Rz), respectively.
Figure 2. (a) Coupons manufactured by hybrid (LPBF) manufacturing showing the as-printed (P) as well as printed and machined (P&M) surfaces, (b) extraction scheme of tensile specimens from each coupon, (c) geometry of each tensile specimen, and (d) X-ray µCT set up for inspecting each tensile specimen.
Each coupon was then sectioned first along the YZ plane into two halves—A and B (as shown in b). Section A was used to extract specimens for density, X-ray µCT, and tensile property measurements, while section B was used to extract specimens for metallographic and hardness evaluations. From section A, 3 specimens were extracted by EDM through the thickness in the build direction (BD) of each coupon (160 W, 240 W, 320 W, and 380 W), as shown in b, and then machined/milled to the geometry of a standard sub-size tensile specimen (as shown in c), according to the principles given in ASTM E8M [
33] for a gage length of 25 mm. After machining and before tensile testing, these test specimens were examined for porosity and density using 3 methods: Archimedes [
34], helium (He) gas pycnometry [
35], and X-ray µCT. Density measurements using the Archimedes and He gas pycnometry methods were undertaken with an AND BM-500 density measurement kit and an Anton Paar Ultrapyc 5000 system, respectively. For the calculation of relative density, a theoretical value of 8.1 g/cm
3 was used for 18Ni-300 maraging steel [
1]. X-ray µCT was performed on the gage length of the tensile specimens to evaluate the porosity distribution and pore size using a Nikon HMXST 225 system (Nikon Metrology Inc., USA) equipped with a Perkin-Elmer 1621AN CsI (2000 × 2000 pixels, 40 cm × 40 cm, 200 µm/pixel) detector panel (as shown in d). The scans were undertaken at two magnification levels: first, at a magnification level of 10.9X which allowed for a complete visualization of the gage length and gave a voxel size of 18.4 μm; and second, at a higher magnification of 46X which gave a voxel size of 4.4 μm. The X-ray µCT was operated at a voltage of 120 kV, a current of 58 µA with a 0.25-mm Ag filter, and an exposure time of 1000 ms. For image analysis, Dragonfly software was utilized for 3D reconstruction to analyze the volume and size distribution of the pores using manual segmentation.
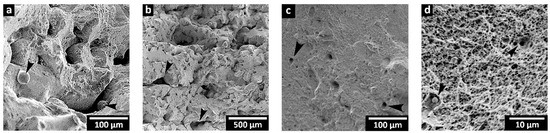
Tensile testing of the 12 specimens—3 per each power level (160 W, 240 W, 320 W, and 380 W), which were extracted from the top, middle, and bottom of section A in the 4 as-printed coupons—was performed under ambient conditions using a 250-kN MTS testing frame integrated with a laser extensometer. Tensile tests were conducted until rupture using displacement control at a rate of 0.4 mm/min. The tensile properties evaluated in this work included the yield strength or 0.2% proof stress (YS), UTS, EL, and elastic modulus (E). The fracture surfaces of the specimens after tensile testing were observed using a SEM at 15 keV to examine the failure characteristics of the 18Ni-300 maraging steel in the presence of different pore structures (interconnected, isolated).
On the other hand, the section B (as shown in b) portion of the 4 as-printed coupons (160 W, 240 W, 320 W, and 380 W) was utilized for metallographic and hardness evaluations. To examine the 3D characteristics of the 18Ni-300 maraging steel macro/microstructures, 3 orthogonal planes (X-Y, Y-Z, X-Z) were extracted for each process condition (160 W, 240 W, 320 W, and 380 W) and prepared for metallography by cold mounting, followed by automated grinding and polishing steps, as described in [
36], to obtain a 0.04-µm finish. To reveal the general microstructure, the specimens were chemically etched at ambient temperature by immersing in a 2% Nital (nitric acid in ethanol) solution for 2 min.
Two test methods were used to measure the hardness of the specimens: Rockwell and Vickers, according to ASTM standard specifications, as given in [
37,
38], respectively. To measure the bulk hardness, Rockwell testing was conducted using a diamond rounded-tip cone indenter (ground at 120°) with a diameter of 0.2 mm and a minor load of 10 kg, followed by a major load of 150 kg, in accordance with guidelines for the C-scale typically used for steels. At least 5 Rockwell C hardness (HRC) measurements were carried out for each specimen condition (160 W, 240 W, 320 W, and 380 W). Vickers microhardness (HV) measurements were performed on the specimens prepared with a polished (mirror finished) surface using a Struers DuraScan 80 hardness tester (Ballerup, Denmark) with a fully automatic cycle [
39]. The reported Vickers hardness distribution across the specimen cross-sections was determined from the average of 3 measurements for each point with a load of 500 g, an indent spacing of 0.8 mm, and a dwell period of 15 s.
3. Results and Data Analysis
3.1. Surface Quality
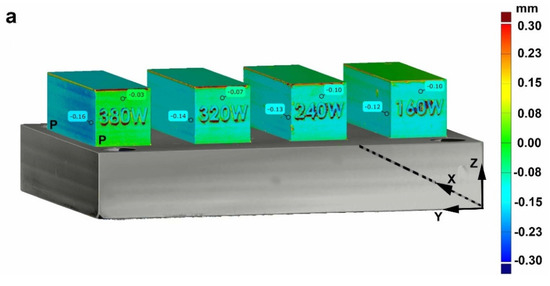
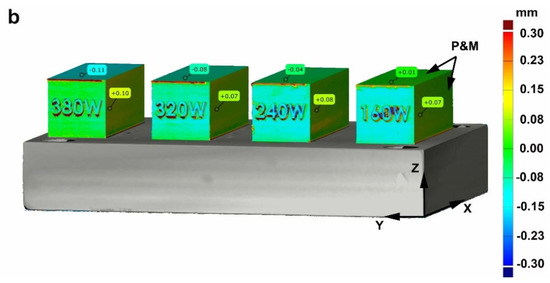
The high thermal gradients and cyclic thermal expansion/shrinkage, occurring in 18Ni-300 maraging steel parts printed using LPBF AM, are a source of plastic strains that can affect the distribution of internal stresses (also known as residual stresses) and result in distortions that may render the part out of tolerance with respect to the initial CAD geometry. Thus, the 4 rectangular prismatic-shaped coupons, still attached to the build plate after hybrid manufacturing (a), were inspected using an ATOS Core Optical 3D scanning system to evaluate the distortions/deviations in their geometry relative to the CAD model using a best-fit algorithm. For the 4 coupons fabricated by hybrid manufacturing, describes the inspection results through a contour map with a color scale selected for the range of -0.3 mm to 0.3 mm in distortion/deviation. Overall, the deviations between the geometry of the coupons and the CAD model were higher for the as-printed surfaces (a), ranging from about 30 μm to 160 μm. After machining, the deviations (b) could be reduced to values between 10 μm and 110 μm, indicating high accuracy in the final geometry. It is noteworthy that the highest deviations were noticed for the as-printed surfaces built at 380 W, which was at the highest infill ED of 90.5 J/mm
3 used in the present study. Previously, thermal simulation of the LPBF process has indicated high sensitivity of the part dimensions to the process parameters affecting the ED [
40], which reasonably explains the current findings of lower dimensional precision/accuracy for the 380 W condition.
Figure 3. Contour plots showing the out-of-plane deviations from the CAD model of the 4 coupons manufactured at different power levels (a) as-printed (P) surfaces and (b) printed and machined (P&M) surfaces.
To understand the surface quality of the 18Ni-300 maraging steel produced by hybrid (LPBF) manufacturing, the average values of the different roughness parameters were measured on linear profiles and surface areas of the as-printed and machined faces of the 4 coupons, as given in . It is noteworthy that, previously, Sa and Sq were reported to be suitable areal parameters for describing the surfaces produced in LPBF AM applications [
41]; however, in the current study, linear profile roughness parameters were also examined, as these remain predominant in industrial manufacturing sites for surface quality inspections due to current international standards being based on two-dimensional (2D) measurement and characterization [
42].
Table 3. Roughness parameters measured on different walls/faces of coupons produced using hybrid (LPBF) manufacturing at different power levels.
On the as-printed vertical side-walls, the lowest and highest values for the linear and areal surface roughness parameters (Ra/Sa, Rq/Sq and Rz/Sz) were measured for the 240 W and 380 W conditions, respectively. Furthermore, reducing the power level from 240 W to 160 W or increasing it from 240 W to 320 W increased the linear and areal surface roughness parameters, and suggests a balanced/optimized power level at 240 W, vis-à-vis the surface finish. Overall, for the vertical side-wall surfaces printed at the four power levels, the measured Ra (ranging from 9.54–12.26 µm) and Sa (ranging from 8.02–14.64 µm) data were in good agreement with the manufacturer’s reference Sa values of 6.5 µm to 15 µm that varied for 18Ni-300 maraging steel depending on the applied processing variables, as reported in [
25]. In particular, the source of roughness on the vertical side-walls built using LPBF technology has been attributed to the layered nature of the process, which forms stair-step delineations that depend strongly on the layer thickness and the process parameters that influence it (e.g., P, v, h, etc.), as well as the orientation of the surface relative to BD [
16,
43,
44]. Thus, the surface roughness can be improved directly by decreasing the layer thickness or through the several interlinked factors in the LPBF process (as mentioned above). In case of the latter, inappropriate heat input for contour passes during LPBF processing has been linked to higher roughness due to melt pool instabilities manifesting into unusual surface irregularities [
45,
46]. Specifically, too low values for the contour ED lead to an unstable deposition of scan tracks that exhibit a lack of melting and balling, which, in turn, increase the surface roughness [
47]. By contrast, too high ED values for the contour passes cause evaporation and lead to high roughness [
48]. Previously, Mutua et al. [
26] examined 18Ni-300 maraging steel produced using the Matsuura LUMEX Avance-25 system and reported a minimum Ra of 35 μm for an « optimal » infill ED setting of 71.4 J/mm
3 (using a P of 300 W, spot diameter of 200 µm, h of 120 µm, v of 700 mm/s and t of 50 µm), above and below which the surface roughness was higher (50 μm—70 μm). Though the absolute Ra values reported by Mutua et al. [
26] are considerably higher than the manufacturer’s reference values, as well as those determined in this work, the trends remain similar. This reasonably supports the findings for the 240 W power level (or contour ED of 28.6 J/mm
3) condition that exhibited lower roughness parameters compared to the lowest setting at 160 W (contour ED of 19.0 J/mm
3) and/or higher settings at 320 W (contour ED of 38.1 J/mm
3) and 380 W (contour ED of 45.2 J/mm
3), which will be discussed below in relation to the changes in density and porosity characteristics.
In case of the machined surfaces, the Ra and Sa were typically more than an order of magnitude lower than the as-printed surfaces. On the vertical side-wall surfaces, the Ra and Sa values ranged from 0.32 µm to 0.65 µm and 0.43 µm to 0.8 µm, respectively. The Ra and Sa values on the horizontal top-face surfaces were comparable, ranging from 0.38 µm to 0.45 µm and 0.47 µm to 0.59 µm, respectively. These findings offer strong evidence of the high efficiency and process flexibility possible with the hybrid (LPBF) manufacturing technology; the superior capacity of the milling process to unequivocally improve the surface finish renders greater flexibility to optimize the LPBF process for material performance requirements. Overall, the surface roughness parameters determined in the present study for the machined surfaces of 18Ni-300 maraging steel are in good agreement with the findings of Wüst et al. [
25], who reported Ra and/or Sa values that depended on the milling parameters and ranged from 0.292 µm to 0.469 µm for vertical surfaces and 0.763 µm to 1.173 µm on horizontal surfaces.
3.2. Porosity and Density Characteristics
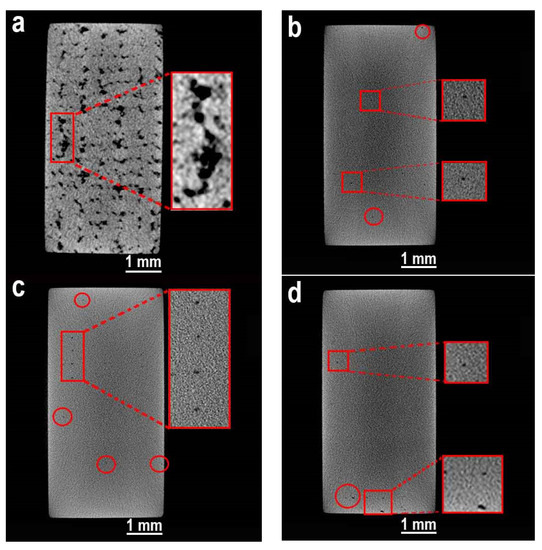
The porosity and density were characterized by three methods: X-ray µCT, Archimedes, and gas pycnometry methods. First, the pore characteristics were explored by X-ray µCT, as shown in . From a, it is apparent that LPBF processing at a power of 160 W (ED of 38.1 J/mm3) resulted in numerous remnant pores (i.e., dark areas in X-ray image) that were large, irregularly-shaped, interconnected, and preferentially distributed in the interlayer regions. The occurrence of such pores can be attributed to the insufficient infill ED at 160 W that prevented adequate melting of the powder and led to the unstable/irregular deposition of scan tracks with lack of fusion defects. By increasing the power level to 240 W, the higher infill ED of 57.1 J/mm3 improved densification of the powder during LPBF processing, as evidenced in b by the considerable reduction in the number and size of pores, which were mostly regular-in-shape (nearly spherical), closed, and less than 50 µm in size (as highlighted in the inset images). The X-ray µCT scan of the 18Ni-300 maraging steel fabricated at a power level of 320 W (c) appeared to be relatively similar to that observed for the 240 W condition, and the isolated pores observed were also smaller than 50 µm in size. At the maximum power of 380 W (and infill ED of 90.5 J/mm3) used in this study, coarsening of the pores was obvious—especially in the inset images displayed in d—with typical sizes ranging from 50 µm to 100 µm (or slightly higher).
Figure 4. Representative TD images from X-ray µCT scanning of the gage length in the tensile specimens extracted from the coupons fabricated at: (a) 160 W, (b) 240 W, (c) 320 W, and (d) 380 W power levels.
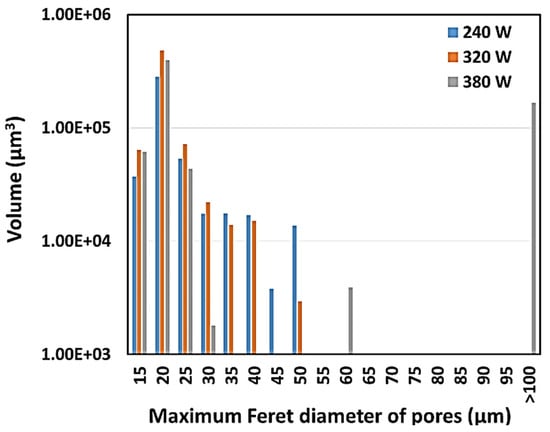
To understand the size distribution and volume of pores, the high magnification X-ray µCT scans of the specimens fabricated at power levels of 240 W, 320 W, and 380 W were analyzed by segmenting the images for pores containing at least five voxels, which, thereby, filtered out defects smaller than 12 µm in size. shows the pore volume distribution as a function of the maximum Feret diameter of the pores in the 18Ni-300 maraging steel processed at the 240 W, 320 W, and 380 W power levels. It is noteworthy that the maximum Feret diameter of each pore is the length of its longest axis; thus, the Feret diameter will usually vary much more for irregularly shaped pores relative to regularly shaped (spherical) pores. Considering this, a key observation from is the similar pore characteristics for the 240 W and 320 W conditions. Nonetheless, LPBF processing at 320 W seems to result in a greater volume of smaller pores (15 µm to 30 µm) and a lower volume of coarser pores (35 µm to 50 µm) relative to the 240 W condition, which may point to a slightly more improved situation for densification at 320 W relative to the 240 W power level. Further increases in the power level to 380 W, however, led to an increase in the volume of coarser pores (i.e., 60 µm to >100 µm). The formation of coarser pores at 380 W can be attributed to excessive power level, which promotes evaporation, the development of gas bubbles, and the eventual coalescence of many small pores into fewer larger pores [
49].
Figure 5. Plot of the pore volume versus their maximum Feret diameter determined from µCT analyzes of the specimens produced at 240 W, 320 W, and 380 W.
The density values measured by the Archimedes and He gas pycnometry methods are tabulated in for 18Ni-300 maraging steel manufactured at the different power levels. The 160 W power level produced the lowest densities of 7.56 g/cm3 and 7.98 g/cm3, as measured by the Archimedes and gas pycnometry methods, respectively. The low relative densities (93.3–98.5%), which signify the highest amount of pores measured for the 160 W condition, agree well with the X-ray µCT observations in a of large interconnected pores with lack of fusion layers that were attributed to the low infill ED (38.1 J/mm3). By contrast, the other three power levels showed significantly higher densities with relative densities ranging from 99.0% to 99.8%. However, considering the standard deviation values of the density datasets, the densities measured by the Archimedes and gas pycnometry methods for 240 W, 320 W, and 360 W are statistically equivalent. Nonetheless, the 320 W condition—with the highest Archimedes density of 8.07 g/cm3—possibly ranks slightly better than the 240 W and 380 W power levels, especially when including the µCT observations () and analyzes ().
Table 4. Density and porosity characteristics of 18Ni-300 maraging steel produced by hybrid (LPBF) manufacturing.
3.3. Macro/Microstructures
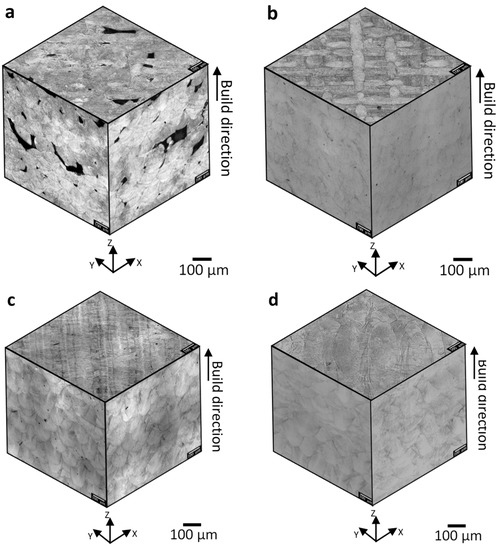
Representative 2D macrostructures, imaged optically on the three orthogonal planes, are shown in a–d for the 18Ni-300 maraging steel produced at the four power levels. For the 160 W condition, the microstructure on all three orthogonal planes (a) showed numerous large, irregularly shaped, and interconnected pores (i.e., black regions in optical images). The microstructures along the BD—X-Z and Y-Z planes—showed that these pores were preferentially located in the interlayers that exhibited lack of fusion characteristics and the occasional balling behavior due to insufficient melting of the powder layers at the low applied power level (160 W) and infill ED (38. 1 J/mm
3). Such defects have also been observed previously during LPBF processing of other metals, such as titanium and aluminum alloys [
50,
51], when the insufficient energy input caused an increase in the melt pool discontinuity and created layered lack of fusion defects, which manifested as irregularly-shaped pores with un-melted metal powders.
Figure 6. Representative optical microscopy images on the three orthogonal planes of the as-printed maraging steel at different powers (a) 160 W, (b) 240 W, (c) 320 W, and (d) 380 W.
The macrostructures of the 18Ni-300 maraging steel manufactured at the higher power levels of 240 W (b), 320 W (c) and 380 W (d) were also examined optically in the three orthogonal planes, comprising the X-Y plane in the transverse direction (TD) which is normal to X-Z and Y-Z planes in the BD. In both the TD and BD, the improved densification characteristics were apparent for all three power levels, as the macrostructures showed no cracking (that is often difficult to detect through µCT) and only a limited number of small pores. This finding corroborates well with the high relative densities (>99.0%), as well as the pore size and distribution results in .
Furthermore, for the 240 W condition (infill ED of 57.1 J/mm
3), the rastering scan pattern and the layer-by-layer rotation (at an angle of 90°) applied during LPBF processing of 18Ni-300 maraging steel was clearly evident in the TD, as displayed in b. The average width of the scan tracks for the 240 W condition was roughly 122 µm, approximately equal to the h = 120 µm selected/used in the present study. Increasing the power level to 320 W (infill ED of 76.2 J/mm
3) or 380 W (infill ED of 90.5 J/mm
3) had the effect of smoothing the scan tracks and rendering the rastering pattern less distinctly visible, as seen by comparing c,d, respectively, and with b for the 240 W condition. With increasing power level, the average width of the scan tracks was also observed to increase (134 µm at 320 W and 153 µm at 380 W). By contrast, along the BD, the macrostructure consisted of overlapping melt pool boundaries with an average melt pool (bead) width and depth of 138 µm and 105 µm, respectively, for the 240 W condition. As the melt pool dimensions also depend on the processing parameters (laser spot size/diameter, ED, layer thickness, etc.) [
52], with increasing power level during LPBF processing, the bead width increased from 138 µm at 240 W, to 154 µm at 320 W, and 173 µm at 380 W. This is in agreement with reported studies on LPBF processing of steels that showed increasing bead width with increasing power level [
53,
54].
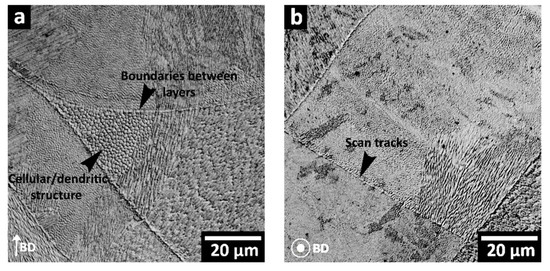
Closer examination of the individual melt pools within the as-printed macrostructure of the 18Ni-300 maraging steel revealed a microstructure consisting of remnant solidification cells, as shown in a,b for the BD and TD. Within the epitaxially grown grains, the different remnant cells were observed to have an average spacing of ~0.67 µm with orientations mostly perpendicular to the melt pool boundaries, but other directions were also observed, owing to the preferential growth direction (100) in cubic structures, as discussed theoretically in [
55]. The presence of such remnant cellular structures within the melt pool boundaries of 18Ni-300 maraging steels is inherent to the rapid rate of melt pool solidification (on the order of 10
6 °C/s) during LPBF processing [
56,
57,
58].
Figure 7. Representative optical microscopy images of as-printed maraging steel (a) along the BD and (b) normal to the BD (TD).
3.4. Mechanical Properties
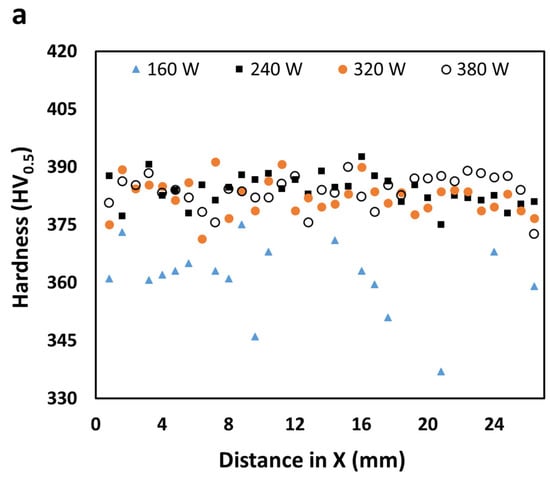
The mechanical properties of the 18Ni-300 maraging steel manufactured at the different power levels were first measured through hardness testing; the average bulk hardness was determined by Rockwell testing on a C scale, while the microhardness was measured by the Vickers test. The average hardness values of the 18Ni-300 maraging steels produced at the four different power levels are tabulated in . At the lowest power level of 160 W, the average hardness was 25.3 ± 4.7 HRC and 353.8 ± 25.2 HV
0.5. Additionally, the microhardness values in the BD and TD of 359.2 ± 13.3 HV
0.5 and 348.4 ± 37.1 HV
0.5, respectively, showed considerable scattering of the data, as evident from the high standard deviations calculated. Compared to the 160 W condition, increasing the power level to 240 W, 320 W, and 380 W increased the hardness considerably—by more than 40% in Rockwell C hardness and ~6% in Vickers microhardness. Moreover, with increasing power from 240 W to 380 W, there appeared to be the possible trend of increasing hardness; however, considering the standard deviations, the measured bulk hardness values (ranging from 35.9 to 37.2 HRC), as well as the Vickers microhardness values in the TD (ranging from 379.7 to 383.8 HV
0.5) and in the BD (ranging from 379.2 to 381.9 HV
0.5), are more likely to be statistically equivalent. This is clearly illustrated in a,b that shows the extent of scattering in the microhardness data in the TD and BD for the 18Ni-300 maraging steel manufactured at the four power levels. In case of the 160 W condition, the high data scatter can be attributed to low microhardness regions measured in the vicinity of the lack of fusion layered defects or areas with large interconnected pores in the macrostructure (a). The presence of these defects and the low relative density (93.3%) in the 160 W condition compromise both the microhardness and bulk hardness relative to that obtained for the 18Ni-300 maraging steel manufactured at the higher power levels, which had no lack of fusion defects (isolated pores only), lower amounts of porosity, and relative densities above 99.0%. Finally, as a point of comparison for these hardness values measured in the current study, the bulk hardness of conventionally manufactured (by hot rolling) 18 Ni-300 maraging steel in the annealed condition has been reported as 30–32 HRC [
2]. The higher hardness of the 18Ni-300 maraging steel manufactured additively has been attributed to the fine microstructure that results from the rapid cooling conditions during LPBF processing [
26]. Previously, Bai et al. [
11] reported an average microhardness value of 381 HV
0.2, and Chada et al. [
59] reported 35 ± 1 HRC for as-printed 18Ni-300 maraging steel manufactured with stand-alone LPBF technologies, which support the present findings for the 18Ni-300 maraging steel produced by hybrid manufacturing with the Matsuura LUMEX Avance-25 technology reasonably well.
Figure 8. Variation in the microhardness of 18Ni-300 maraging steel produced by hybrid (LPBF) manufacturing at different power levels: (a) TD and (b) BD.
Table 5. Average hardness values of maraging steel coupons manufactured by hybrid (LPBF) manufacturing at different power levels.
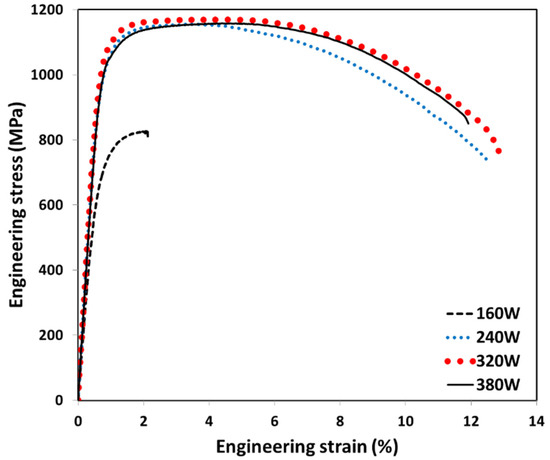
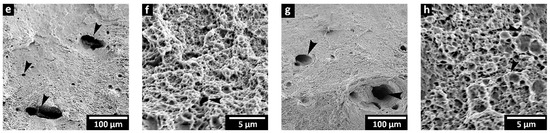
Next, the mechanical response of the as-printed 18Ni-300 maraging steel was evaluated by uniaxial tensile testing to obtain the engineering strain-stress curves, as shown in , and to determine the average values for the YS, UTS, EL, and E, as tabulated in for the coupons built at the four different power levels. For the 160 W condition, early failure of the specimens occurred at relatively low tensile stresses and strains relative to the other three power levels. This is unsurprising considering the low relative density (93.3%) and the characteristics of defects observed—such as the large interconnected pores and the layered lack of fusion defects—in the X-ray µCT images (a) and the macrostructure (a) of the 18Ni-300 maraging steel manufactured at 160 W. Overall, for the 160 W power level, the tensile properties of the maraging steel were about ~30% lower in strength (both YS and UTS), 24% lower in stiffness (E) and more than 80% lower in ductility (EL) relative to 240 W condition. On the other hand, the tensile mechanical responses of the 18Ni-300 maraging steel printed at 240 W, 320 W, and 380 W were mostly similar, as shown in , and the measured tensile properties indicated relatively high values for the YS (1005.6–1061.9 MPa), UTS (1157.6–1171.3 MPa), E (160.6–169.7 GPa), and EL (12.5–12.8%), which corroborates well with previously discussed results of the pore characteristics from the µCT, density, and macrostructure. Here, it is worth pointing out that the difference in relative density between the 160 W condition and the three other power levels was minor (at ~6%). Thus, the disparate characteristics of the pores—large, elongated, and interconnected for the 160 W condition versus fine, rounded, and isolated for the 240 W, 320 W, and 380 W conditions—more likely had a greater impact on the mechanical performance. In this regard, it is interesting to note the slightly better strength properties of the 320 W condition that had a larger amount of finer pores and a smaller amount of larger pores () relative to the 240 W condition. Furthermore, coarsening of the pores in the 380 W condition was seen to reduce the tensile properties by about 4% in the YS, 3% in the EL and 5% in the E.
Figure 9. Average tensile stress-strain curves for 18Ni-300 maraging steel produced by hybrid (LPBF) manufacturing at power levels of 160W, 240 W, 320 W, and 380 W.
Table 6. Average as-printed tensile properties of 18Ni-300 maraging steel produced by hybrid (LPBF) manufacturing at different power levels.
A further reflection is for the engineering stress-strain curves of the 240 W, 320 W, and 380 W conditions (as given in ) that show a combination of high UTS and moderate ductility (total strain of ~12%), indicating relatively high energy absorption before failure. More specifically, these three curves show a similar mechanical response within the initial 4–5% strain region under elastic-to-homogeneous plastic loading conditions, that is, just before reaching the peak stress. After the peak stress, a considerable amount of further straining occurs, representing more than 60% of the total EL to fracture, as observed in . This behavior—with a peak stress at small plastic strains followed by a prolonged region of continued decrease in stress—observed for the 18Ni-300 maraging steel has been reported in other studies [
60,
61].
The tensile properties obtained in the present study for the 320 W condition are compared in with reported data in the open literature from research studies using stand-alone 3D printers for AM of 18Ni-300 maraging steel [
21,
44,
62,
63,
64,
65], as well as for the wrought equivalent alloy [
1]. The tensile properties of 18Ni-300 maraging steel manufactured using a hybrid (LPBF) manufacturing process using the Matsuura LUMEX Avance-25 in the present work shows comparable values and, in some cases, superior tensile properties than that obtained from conventional stand-alone LPBF technologies. The differences can be attributed to the powder composition, process parameters, scanning strategy, heat input, additive system, etc. Moreover, the tensile properties of 18Ni-300 maraging steel produced using hybrid (LPBF) manufacturing or stand-alone LPBF technologies fall in the range of performance data for wrought equivalent alloy in the annealed condition [
1], except for the usual lower E values and, in some cases, also the YS [
26,
66]; this latter may be related to lower strain hardenability effects as discussed in [
59,
61].
Table 7. Comparison of the as-built tensile properties of 18Ni-300 maraging steels produced by hybrid (LPBF) manufacturing using the Matsuura Lumex Avance-25 with conventional (stand-alone) AM or conventional wrought manufacturing.
5. Discussion and Future Scope
The knowledge gained from this present study, on the effect of the power level in the LPBF process on the geometry, surface finish, porosity characteristics, mechanical properties, and fracture behavior, is important for advancing hybrid manufacturing capability for the production of high-quality maraging steel parts with the required performance. Due to the newness of the hybrid (LPBF) manufacturing technology, very limited research has been undertaken to date relative to studies on stand-alone LPBF processing of 18Ni-300 maraging steel, as evidenced by the reported data in . Amongst the reported data on hybrid (LPBF) manufacturing of 18Ni-300 maraging steel, the early research work of Enemuoh et al. [
24] examined the density and mechanical properties of test specimens printed using the Matsuura LUMEX Avance-25 system; however, the process parameters were not disclosed and, without characterization of the powder, porosity and macro/microstructures, linkages to interrelate the materials, and process parameters to the performance was not possible. Around this same time, Mutua et al. [
26] explored the processing window for hybrid (LPBF) manufacturing of 18Ni-300 maraging steel through a design of experiment approach to broadly vary the power level (100–400 W), scan speed (400–1000 mm/s), pitch (0.025–0.2 mm), and spot diameter (0.05–0.3 mm); through their findings, an optimum process window was proposed and, for a scan speed of 700 mm/s, the lower and upper boundaries for the power level were projected to be 160 W and 320 W, respectively, based on a single validation point. In keeping with these findings of Mutua et al. [
26], the current research was deliberated to more closely examine the optimal process window for hybrid (LPBF) manufacturing of 18Ni-300 maraging steel through a systematic variation of the power level from 160 W to 380 W, with the infill scan speed, pitch, and spot diameter held constant at 700 mm/s, 0.12 mm, and 0.2 mm, respectively, so as to match the previously reported validation parameters [
26]. Through the current study, for the first time, the manufacturer’s reference powder for 18Ni-300 maraging steel was characterized and its densification evolution was understood through detailed µCT analysis of the pores. These findings clearly indicated that the characteristics of the 160 W condition (with large lack of fusion defect layers and irregularly-shaped interconnected pores) are far from optimal, as validated through surface finish characteristics, macro/microstructural analysis, hardness and tensile properties, as well as fractography. In addition, the 380 W condition, though considerably better than the 160 W condition, represents an upper limit for the power level, as coarsening of the pores was observed and linked to slightly lower tensile properties. With an eye on the statistical significance of the properties measured, the 240 W and 320 W power levels for hybrid (LPBF) manufacturing of 18Ni-300 maraging steel are equivalent, though the pore size distribution of the latter condition may prove to be more efficacious under future cyclic loading. Thus, the results from the present study delimit a more robust optimum () for the processing window using a power level between 240 W (infill ED = 57.1 J/mm
3) and 380 W (infill ED = 90.5 J/mm
3) during hybrid (LPBF) manufacturing of 18Ni-300 maraging steel; this new optimal process window is also shifted slightly to higher power levels with respect to the process map proposed by Mutua et al. [
26]. The comprehensive analysis presented in the current study also shows the close relationship between porosity evolution and power level during hybrid (LPBF) processing of 18Ni-300 maraging powder, specifically in relation to the understanding of their impact on the material allowable (property) data, which is important for engineering advanced designs and products for diverse applications in industry. Furthermore, having established this robust process window in the present study, future investigation of the fatigue and/or thermomechanical fatigue properties of the maraging steel produced by hybrid (LPBF) manufacturing can be deliberated and analyzed under conditions representative of realistic thermal and mechanical service loads. Of equal importance for future work is the evaluation of the impact of hybrid (LPBF) parameters on the residual stresses and the concomitant development of a 2D finite element model that couples the influence of machining parameters with LBPF processing to predict residual stresses, distortion, and properties. It is expected that this additional experimental and simulation knowhow will further assist process engineers to rapidly design and scale the conditions within the parametric window for hybrid manufacturing of complex geometry parts.
Table 8. Optimal/robust window for LPBF process parameters during hybrid manufacturing of the 18Ni-300 maraging steel.